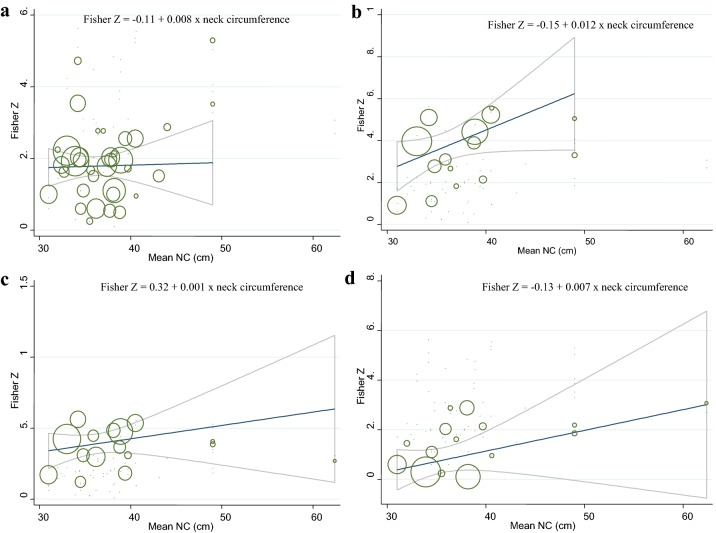
Fig. 3.
a Association between mean neck circumference values and glycemic profiles: meta-regression analysis. The means of neck circumference (cm) were modeled using a linear trend with random-effects meta-regression models. The solid line represents the weighted regression line based on variance-weighted least squares. The gray lines show the 95% CI around the regression line. The circles indicate Fisher Z in each study. The circle size is proportional to the precision of the Fisher Z. For fasting blood sugar: β = 0.008, P = 0.09, I2 residual = 87.08%. b For serum fasting insulin level: β = 0.012, P = 0.12, I2 residual = 94.63%. c For homeostasis model assessment-estimated insulin resistance: β = 0.001, P = 0.83, I2 residual = 95.74%. d For glycated hemoglobin: β = 0.007, P = 0.11, I2 residual = 87.07%

