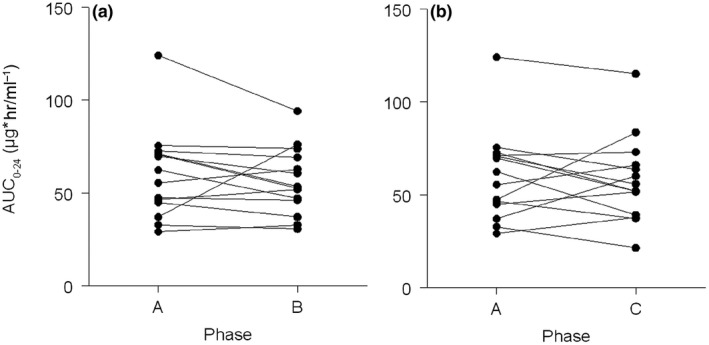
Figure 1.

Regorafenib area under the curve. Regorafenib exposure compared (a) between phase A (regorafenib alone) and phase B (regorafenib concomitantly with esomeprazole), and (b) between phases A and C (regorafenib with esomeprazole 3 hours prior). AUC 0–24, 0–24‐hour area under the concentration‐time curve; hr, hour.
