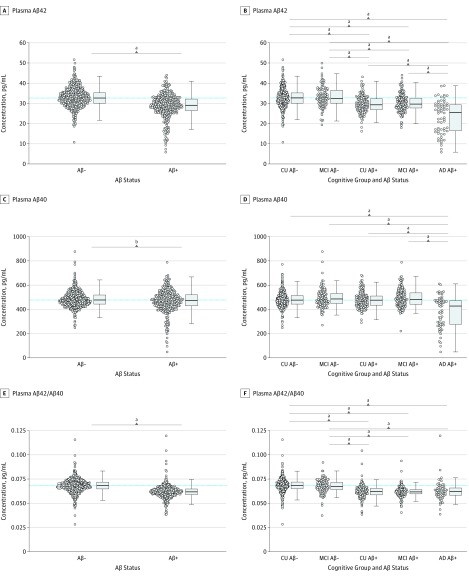
Figure 1. Levels of Plasma β-Amyloid (Aβ) Biomarkers.
Plasma Aβ42 (A), Aβ40 (C), and the plasma Aβ42/Aβ40 ratio (E) in the Aβ-positive (Aβ+) (CSF Aβ42/Aβ40 ≤ 0.059) and Aβ-negative (Aβ−) (CSF Aβ42/Aβ40 > 0.059) groups. Plasma Aβ42 (B), Aβ40 (D), and the plasma Aβ42/Aβ40 ratio (F) in the CU, MCI, and AD participant groups stratified by Aβ status. The dotted lines indicate median levels in the CU Aβ-negative group. P values are calculated from t test (A, C, E) or 1-way analysis of variance and post hoc tests with the statistical significance set to P < .005 (.05/10.00) to account for the Bonferroni correction (B, D, F). The significant findings were similar when adjusting for age and sex (data not shown). Group comparisons of plasma tau, NFH, and NFL are shown in eFigure 2 in the Supplement. AD, Alzheimer disease; CSF, cerebrospinal fluid; CU, cognitively unimpaired; MCI, mild cognitive impairment; NFH, neurofilament heavy chain; and NFL, neurofilament light chain.

