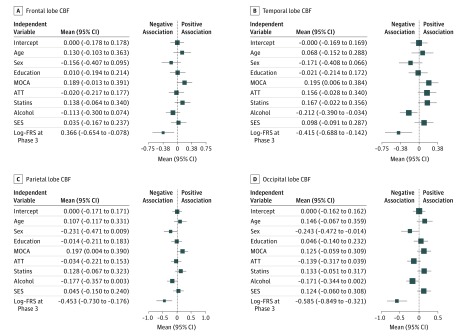
Figure 2. Forest Plot Summarizing Standardized Coefficients for the Regression of Phase 3 Log–Framingham Risk Scores (FRS) With Cerebral Blood Flow (CBF) (N = 116).
Mean values denote the standardized regression coefficients for each independent variable. Log-FRS at phase 3 is significantly associated with CBF to the temporal, parietal, and occipital lobes at a Bonferroni-corrected P < .0125. ATT indicates arterial transit time; MOCA, Montreal Cognitive Assessment score; and SES, socioeconomic status.

