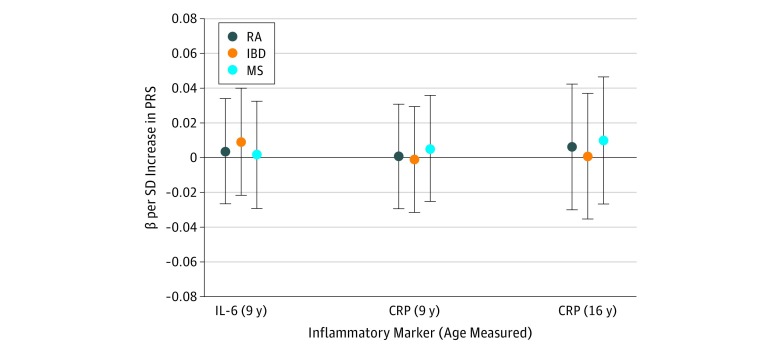
Figure 3. Associations Between Polygenic Risk Scores (PRSs) for Rheumatoid Arthritis (RA), Inflammatory Bowel Disease (IBD), and Multiple Sclerosis (MS) and Inflammatory Markers.
Points represent β values for interleukin 6 (IL-6) and C-reactive protein (CRP), with error bars indicating 95% confidence intervals. β values are shown for PRSs generated using lists of single-nucleotide polymorphisms meeting a P value threshold of .05. The horizontal black line indicates the null value. The number of observations for IL-6 at age 9 years was 4055; CRP at age 9 years, 4064; and CRP at age 16 years, 2779. Numerical results used to generate the figure are presented in eTable 6 in the Supplement.

