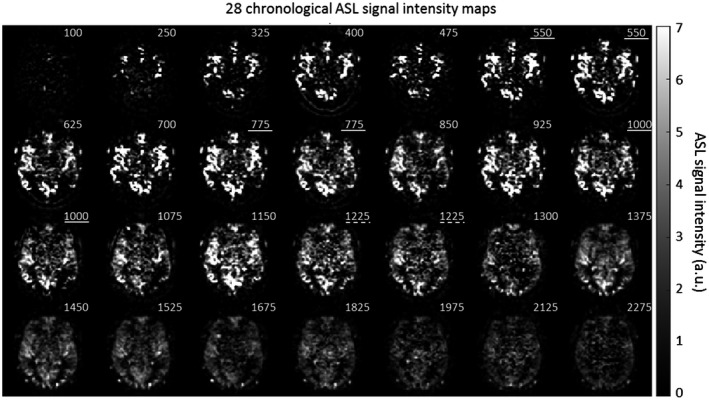
Figure 4.

Subtracted ASL signal intensity maps of 28 chronological time points for slice 8 of volunteer no. 2. The numbers in the upper right corner indicate the PLD (ms) for each image. Images with the same PLD are indicated with a white line. The white dotted line indicates images with the same PLD, but from which the effective labeling duration differed. a.u. = arbitrary units
