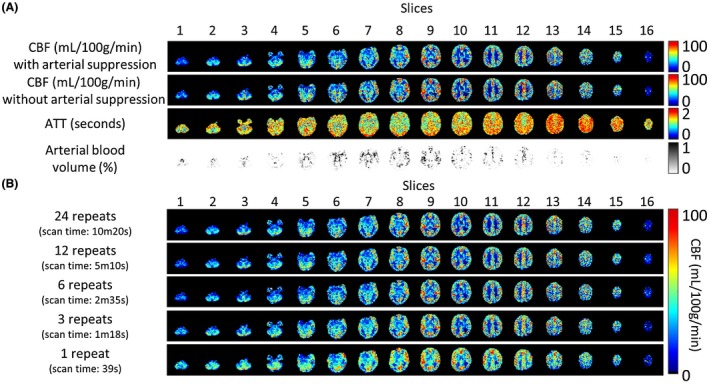
Figure 6.

A, CBF, ATT, and arterial blood volume maps for a single subject. The BASIL toolkit was used to quantify the acquired data, with the first row showing the CBF map including the macrovascular contribution in the Bayesian analysis and the second row the CBF map without inclusion of the arterial compartment in the model. When the macrovascular contribution is not taken into account, CBF is overestimated because of intravascular label. The ATT and arterial blood volume maps are shown in, respectively, the third and fourth row. B, Comparison of CBF maps for different number of repeats included in the postprocessing; only fully sampled Hadamard matrices were included. The CBF maps of 3 repeats are visually comparable to the CBF maps obtained from 24 repeats, whereas the acquisition time is limited to 1m18s
