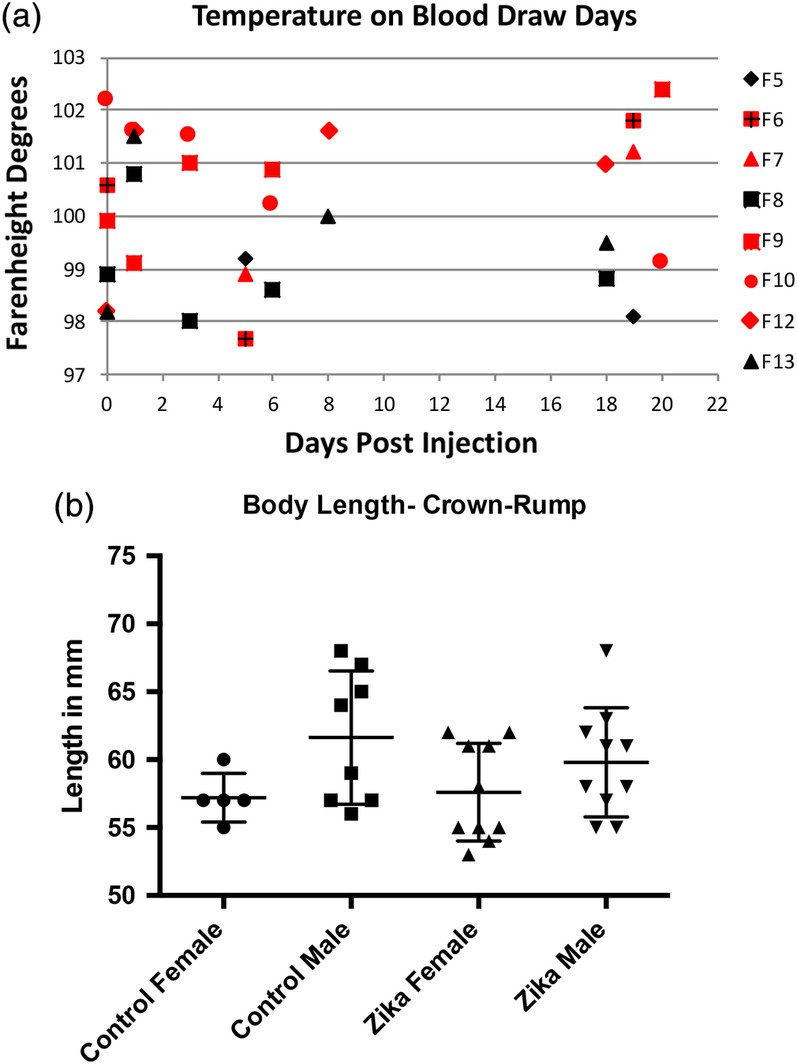
Figure 1.

(a) This graph shows the temperature of each animal on days that we drew blood. Animals with red symbols received injections of Zika virus, while those with black symbols are controls. Although the infected animals seem to show higher overall temperatures, there were no significant differences. (b) Graph of the size (crown‐rump length) of control and Zika treated ferret kits. Included in the graph are measurements of 4 litters, 2 control, and 2 Zika treated. These measurements show that the overall size of the kits is variable. There were no significant differences between groups
