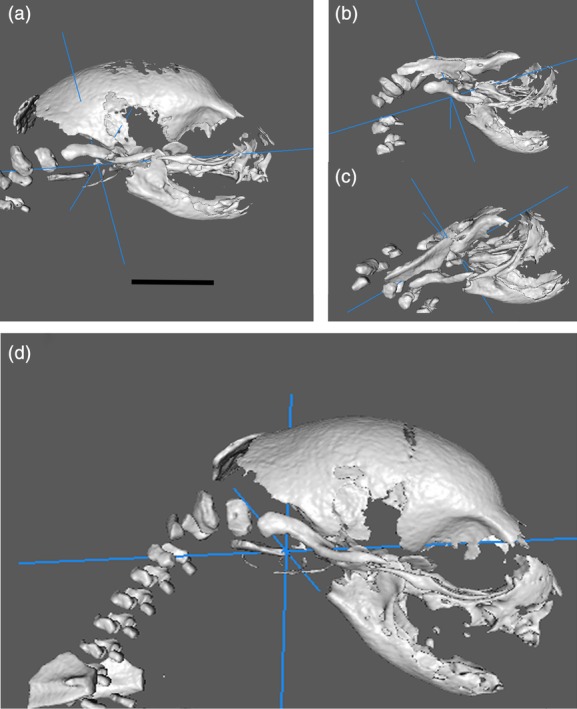
Figure 2.

Examples of CT reconstructions taken from the same litter (a–c) infected with the Zika virus and from a control animal (d). These demonstrate that substantial variability of skull size in the same litter occurs after virus infection. The scale equals 5 mm
