Figure 3.

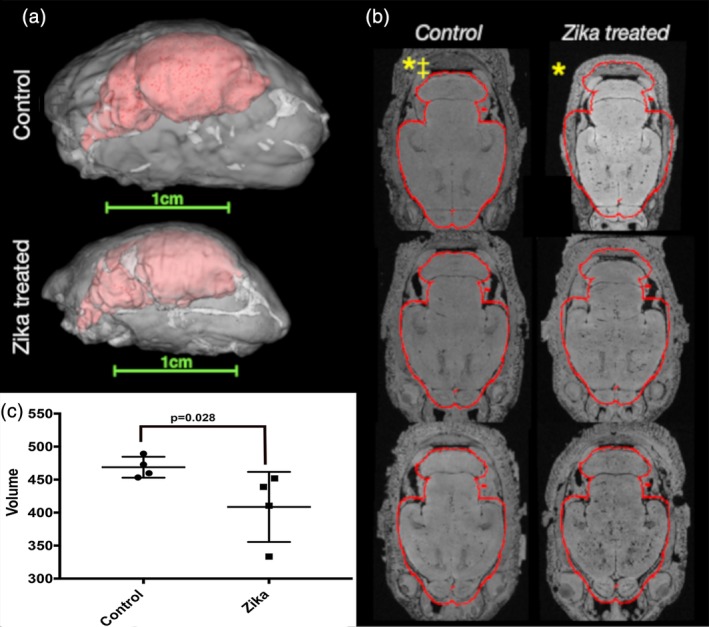
Gross anatomy and volume abnormalities in Zika treated ferret brains (MRI cohort 1). 3D reconstructions of segmented ROI masks for the brains (red) within the heads (white) of ferrets at P0 are shown (a) with the same scaling to demonstrate gross differences in size and anatomy between control and Zika treated specimens. High‐resolution axial images with the same alignment and slice level are shown for all P0 brains in the first imaging cohort of this study (b). A red outline is shown based on the mask for a single control brain and little deviation of the control brain volumes from this outline was found, while the Zika brains were found to be smaller. * denotes brains from b shown in (a). ‡ denotes control brain segmentation used to generate brain mask outline. (c) Is a plot of MRI obtained brain volumes (in mm3) that shows the overall volume of the Zika‐treated brains are significantly smaller than the control brains (p < 0.028, Mann–Whitney U test)
