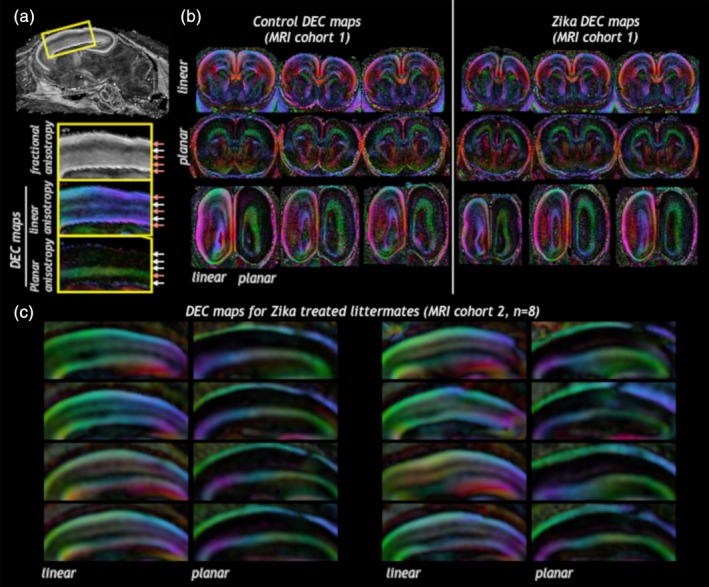
Figure 5.

Cortical zones maintain their overall regional organization according to DTI features in control or Zika treated brains. Linear and planar anisotropy weighted directionally encoded color (DEC) maps were able to distinguish between different cortical zones (a) according to intensity and color of the metric. The presence and organization of cortical zones as indicated by DEC maps were similar in brains from Zika infected litters as from controls (b, MRI cohort 1 and c, MRI cohort 2). Note: This analysis measured laminar organization only, for volume analysis see Figure 7b
