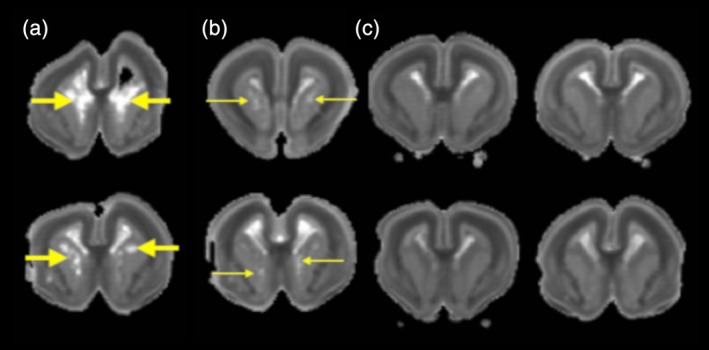
Figure 6.

Voxelwise diffusivity abnormalities of the GE. (a) Trace maps for individual brains from MRI cohort 2 reveal prominently increased trace lesions in the GE (thick yellow arrows) for 2/8 of the brains, (b) while visible trace lesions appear for an additional 2/8 brains (thin yellow arrows) and no lesions evident for the remaining brains of this cohort (c). These trace values suggest vulnerability of the GE with variability across Zika treated littermates
