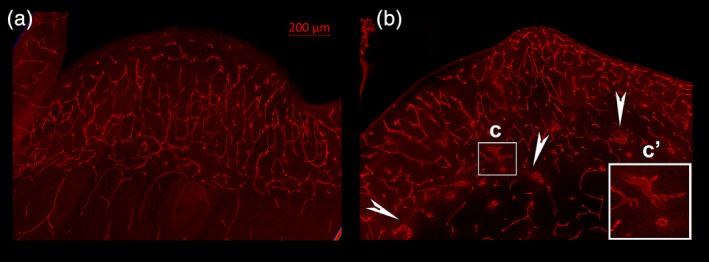
Figure 10.

Images of blood vessels taken through the GE of a control and Zika treated animal. The control GE (a) shows blood vessels that are clearly organized and not hypertrophied. The pattern of distribution of blood vessels in the Zika treated GE (b) is disorganized, however, and also reveals hypertrophied vessels. An example is outlined with the white box (c) and shown at higher power in c’. White arrow heads also point to abnormal appearing blood vessels
