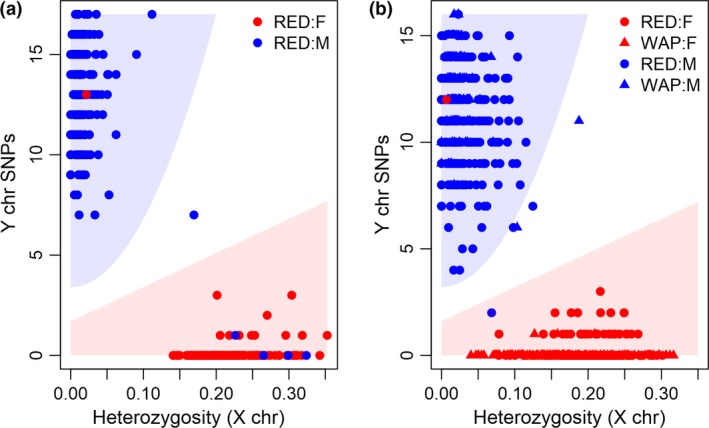
Figure 1.

Gender plot for the (a) training dataset and (b) test dataset. Red symbols represent recorded females, blue symbols represent recorded males, circles represent Red deer and triangles represent Wapiti deer. Animals were predicted male if located in the blue region [], were predicted female if located in the red region [] or otherwise were unassigned gender. Interactive plots of (a) and (b) can be downloaded at https://github.com/AgResearch/GBS_Gender_Predict/tree/master/Supplementary/.
