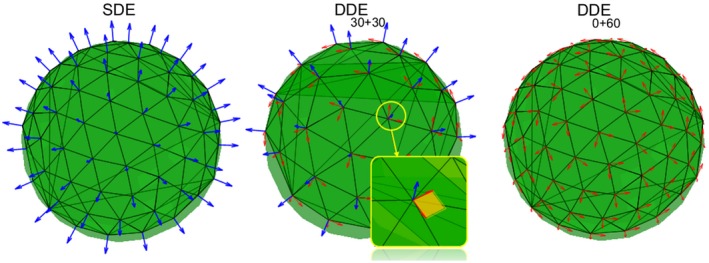
Figure 2.

Diagram of different measurement protocols (SDE, , and ). Only SDE and were used in experiment 1, while they all were used in experiment 2. Blue colors denote the SDE directions or DDE parallel direction pairs. DDE perpendicular direction pairs are in red
