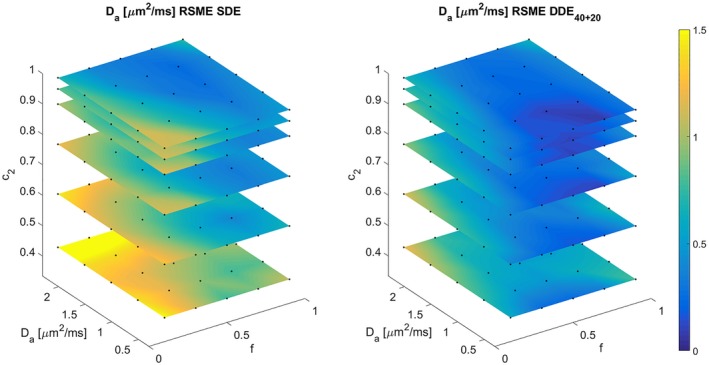
Figure 7.

RMSE of , for SDE and acquisition protocols. This 3D plot shows the projection over f, , and of all the RMSE in the 5D grid. This projection was made by computing the square root of the quadratic mean of the errors in the remaining 2 dimensions (). Black dots denote the actual points in the grid, linear interpolation was used to generate the color figures
