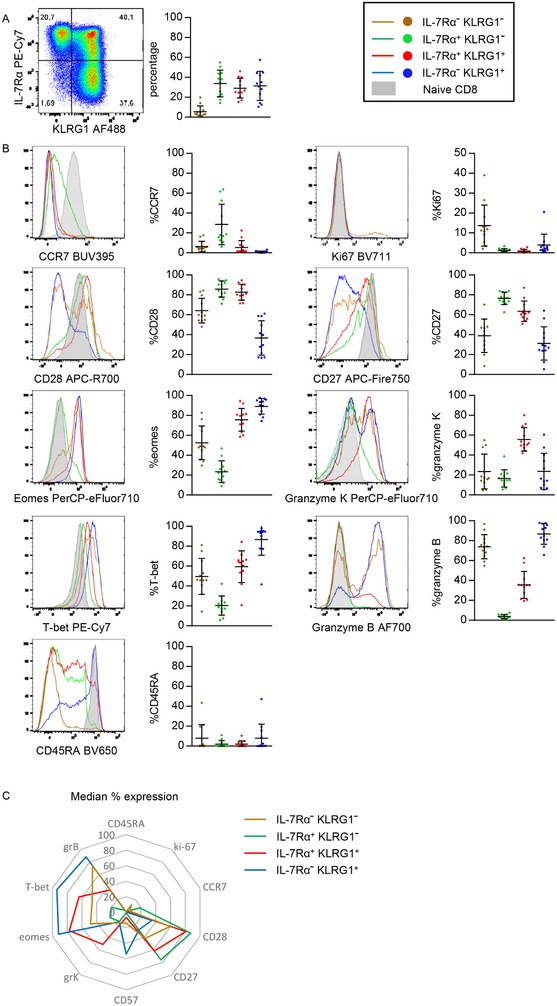
Figure 1.

Distribution and phenotype of KLRG1/IL‐7Rα‐defined subsets in non‐naive CD8+ T cells. (A) (left) Flow cytometric analysis of KLRG1 and IL‐7Rα expression in nonnaive CD8 T cells and (right) distribution of KLRG1/IL‐7Rα‐defined subsets in nonnaive CD8+ T cells from the peripheral blood of 12 healthy donors. (B) Percentages of expression of CCR7, CD28, Eomes, T‐bet, CD45RA (left column top to bottom) and Ki‐67, CD27, granzyme K, granzyme B, and CD57 (right column top to bottom). (C) Spider plot of the mean expression of data shown in B. H‐SNE analysis of the data can be found in Supporting Information Figure 2. Data shown (mean ± SD) are representative of three independent experiments with n = 8, 2, and 4 donors per experiment. Twelve unique donors are shown.
