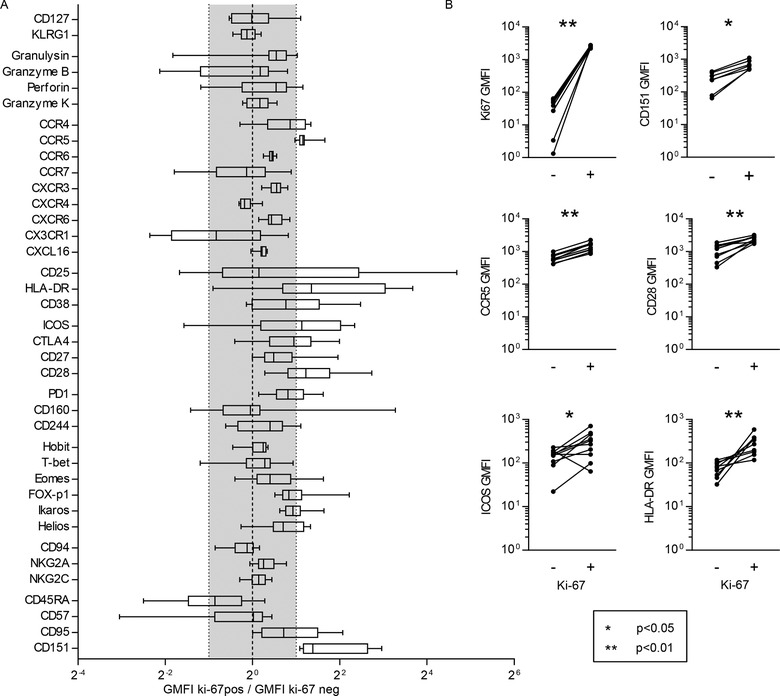
Figure 3.

The Ki‐67+ IL‐7RαloKLRG1lo effector population are activated cells with an effector phenotype. (A) Flow cytometric analysis of IL‐7RαloKLRG1lo nonnaïve CD8+ T cells from the PBMCs from ten buffy coats. Box and whiskers min to max plot of the fold change of the geomean fluorescence intensity (GMFI). The gray area represents changes less than twofold. Only when Ki‐67‐expressing IL‐7RαloKLRG1lo CD8+ T cells had a more than twofold higher or lower mean expression (outside the gray area) expression was considered different. (B) MFI of Ki67, CD151, CCR5, CD28, ICOS, and HLA‐DR on ki‐67‐negative (‐) and ki‐67‐expressing (+) IL‐7RαloKLRG1lo nonnaïve CD8+ T cells. Representative histograms and graphs of the individual fold changes of the GMFI of each of the four KLRG1/IL‐7Rα‐defined subsets in nonnaïve CD8+ T cells of ten buffy coats compared to the naïve (CD27+CD45RA+) CD8+ T cells of the same sample can be found in Supporting Information Figure 4. Data shown (mean ± SD) are from one independent experiments with n = 10 donors per experiment. Statistical analysis used: Wilcoxon matched‐pairs signed rank test.
