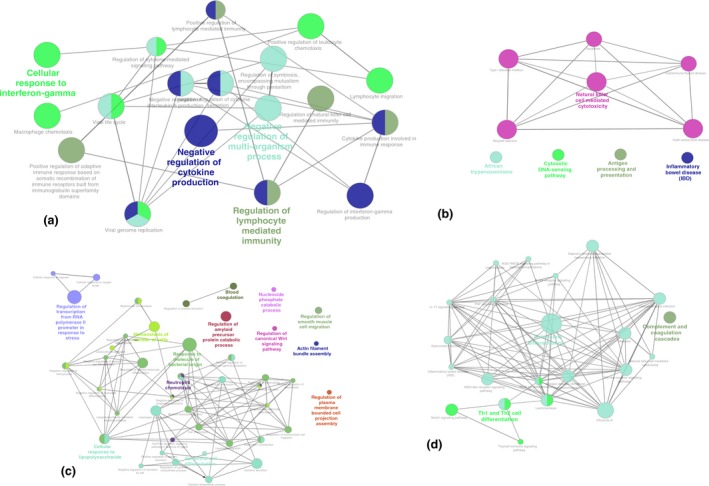
Figure 5.

Network representation of GO and KEGG pathways associated with uniquely differentially expressed genes. Nodes represent GO terms or KEGG pathways, with node size corresponding to the significance of term enrichment, and functionally related groups partially overlap. Network of (a) GO terms and (b) KEGG pathways associated with the genes upregulated in Yakutian cattle. Network of (c) GO terms and (d) KEGG pathways associated with upregulated genes in Holstein cattle. The representative GO terms and KEGG pathways are highlighted in bold.
