
Figure 2.
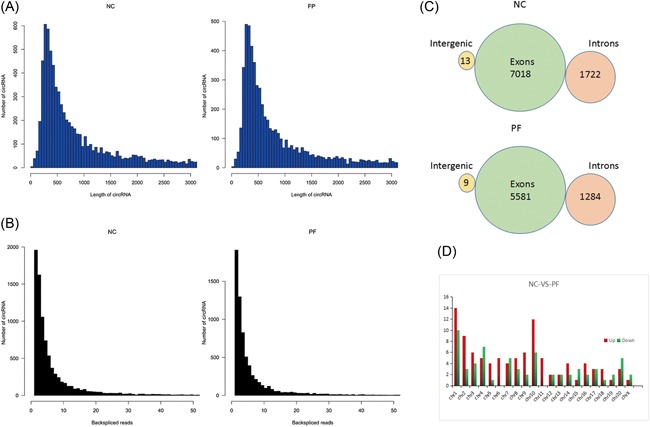
Prediction performance of the total RNA‐Seq data. A, The RNA‐seq reads of circRNAs. B, The back‐spliced junction read pairs of circRNAs. C, The distribution of circRNAs among intergenic exons and introns. D, The chromosome distribution of differentially expressed circRNAs. circRNAs, circular RNAs; NC, normal group; RNA‐seq, RNA sequencing