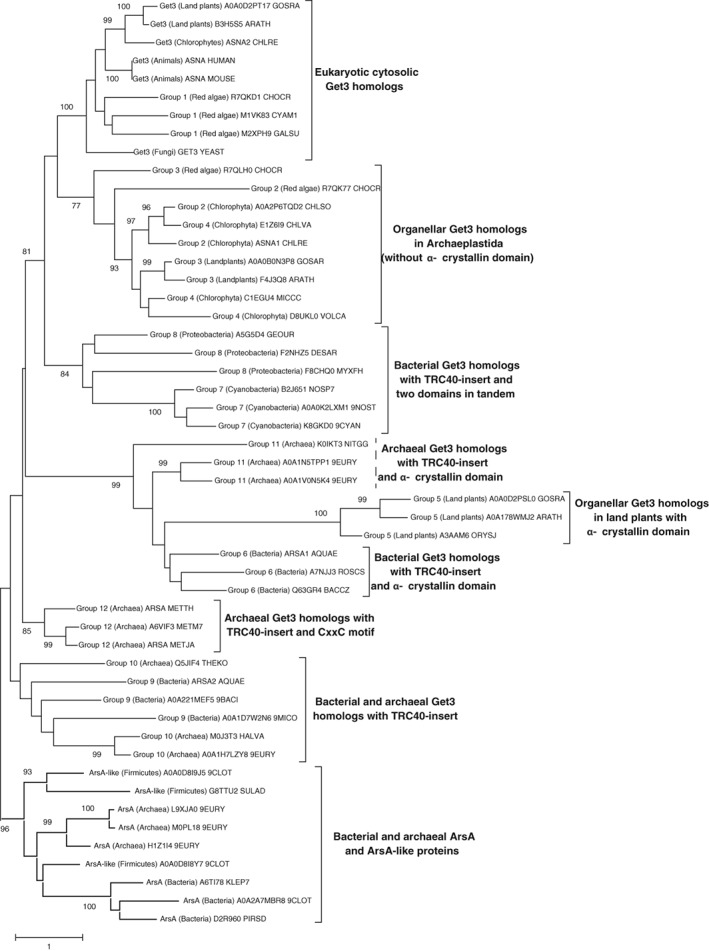
Figure 1.

Maximum likelihood rooted phylogenetic tree of three representative sequences of each group of Get3 homologs as defined in Table 1. Percentage of trees in which the sequences clustered together after applying 1000 bootstraps are indicated at nodes if the value is higher than 70%. Scale bar indicates number of substitutions per site
