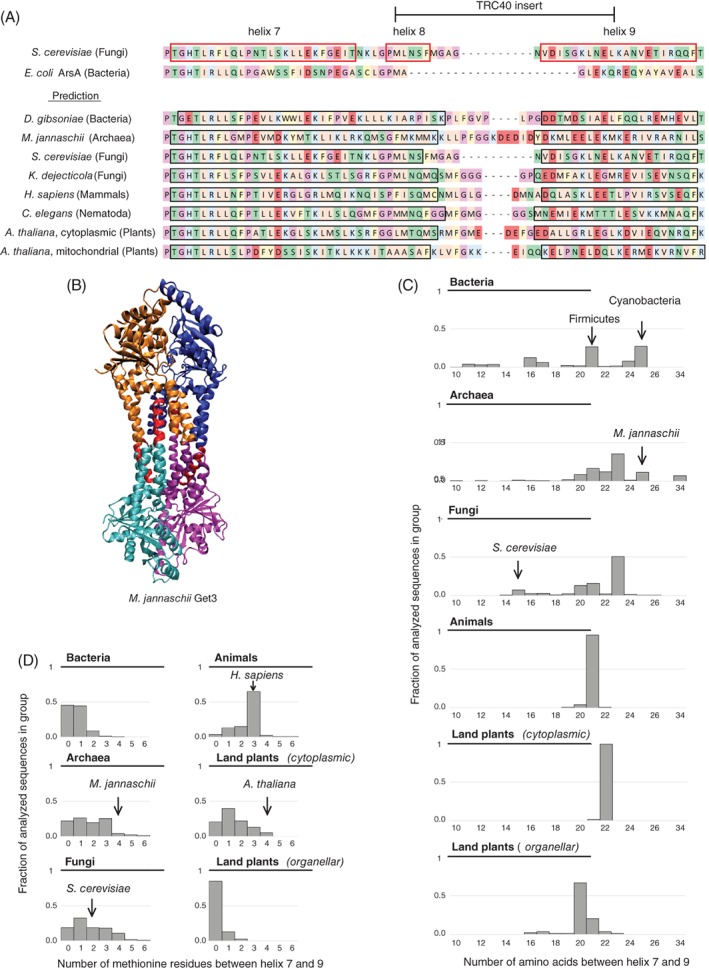
Figure 3.

Comparison of the TRC40‐insert between species. A, Known secondary structure of ScGet3 (top) compared with the predicted structure of the same region in different species (bottom, predicted helices marked with black frame). Hydrophobic residues shown in peach, aromatic residues in ochre, basic residues in blue, acidic residues in red, hydrophilic residues in green, proline and glycine in mauve, cysteine in yellow. B, Structure of M. jannaschii Get3 (PDB ID: 3UG6). Subunits are marked with cyan, magenta, orange and blue. The region homologous to the region between helix 7 and 9 in ScGet3 is shown in red. C, Distribution of the length of the region homologous to the sequence between helix 7 and 9 in ScGet3 among the sequences used for the current analysis. All bins containing at least 1% of the sequences are shown in the chart. Number of analyzed sequences: Bacteria—299; Archaea—376; Fungi—489; Animals—140; Land plants (cytoplasmic) —78; Land plants (organellar, excluding α‐crystallin domain Get3 homologs)—87. D, Distribution of the number of methionine residues in the region homologous to the sequence between helix 7 and 9 in ScGet3 among the sequences used for the current analysis. All bins containing at least 1% of the sequences are shown in the chart. The number of sequences analyzed are as in C
