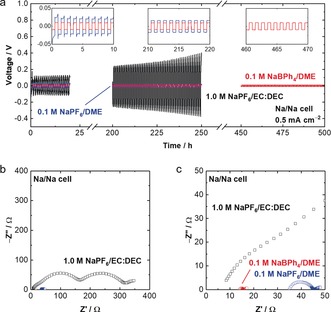
Figure 3.

a) Charge‐discharge voltage profiles of Na/Na symmetric cells in the conventional electrolyte, 0.1 m NaPF6/DME, and 0.1 m NaBPh4/DME at 0.5 mA cm−2 and 25 °C. The profile after 450 h is shown only for 0.1 m NaBPh4/DME. The results of 0.1 m NaTFSA/DME and NaFSA/DME are not shown, because their voltage curves are so unstable and unreproducible. b) Impedance spectra of the Na/Na symmetric cells after one cycle at 25 °C. c) Magnified Figure of the impedance spectra.
