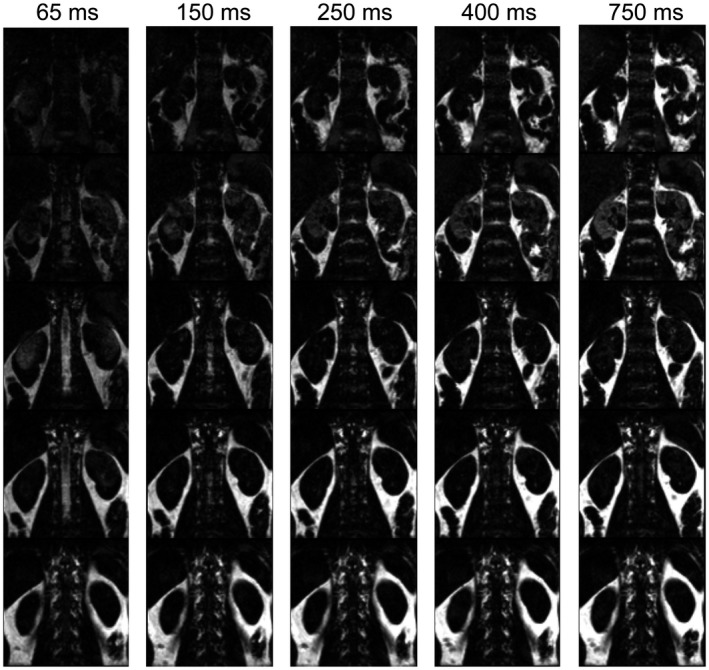
Figure 3.

Fat‐images of five slices (rows) for one subject acquired with different recovery delays (columns). The recovery delay starts from the last excitation for the ASL‐image readout. Fat signal recovery can be seen across slices. With increasing recovery delay, fat signal increases. ASL, arterial spin labeling
