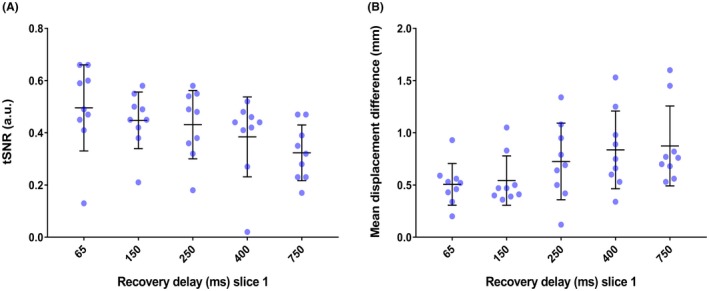
Figure 5.

A, Temporal signal‐to‐noise ratio (tSNR) after image registration on fat‐images (FatReg) for all subjects, individually represented as blue dots. For fat‐images acquired with the shortest delay of 65 ms the highest tSNR is found; with longer delays the tSNR decreases. Outliers belong to one subject. B, Mean displacement difference of all subjects in feet–head direction between ASLReg and FatReg, determined from the translation parameters after the registration procedure. Small displacement difference values indicate agreement between motion correction based upon ASL‐images and fat‐images. ASLReg, registration guided by ASL‐images; FatReg, registration guided by fat‐images
