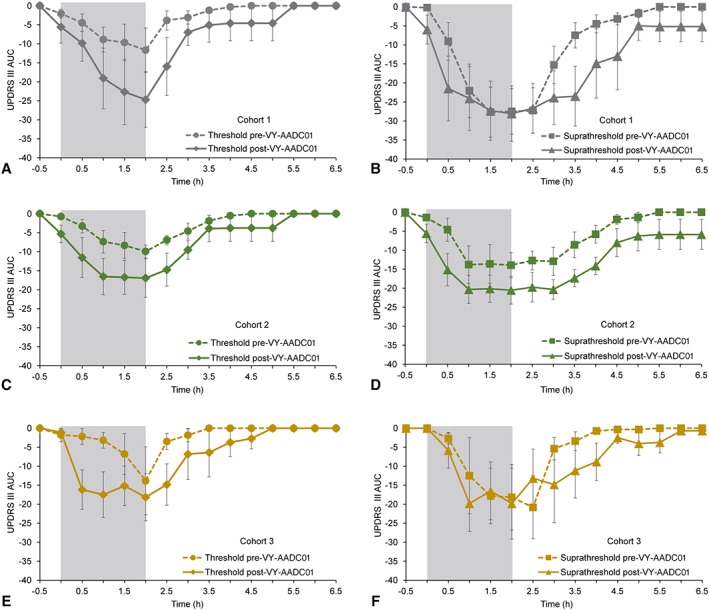
Figure 4.

Time‐action curve for UPDRS‐III for threshold and suprathreshold infusions of intravenous levodopa at baseline and approximately 6 months after administration of VY‐AADC01. The figure shows the UPDRS‐III time‐action curves following a threshold (0.6 mg/kg/h; left side) and suprathreshold (1.2 mg/kg/h; right side) intravenous dose of levodopa by cohort (A,B: cohort 1; C,D: cohort 2; E,F: cohort 3). Lower scores indicate improvement. Dashed lines in each figure show data before VY‐AADC01 administration and solid lines postadministration. The gray box shows the actual infusion time. Note in cohort 2 the time‐action curve for threshold (low‐dose) intravenous levodopa post‐VY‐AADC01 administration (C) appears similar to the suprathreshold (high‐dose) intravenous levodopa pre‐VY‐AADC01 administration (D). AUC = area under the curve; UPDRS = Unified Parkinson's Disease Rating Scale.
