Figure 4.

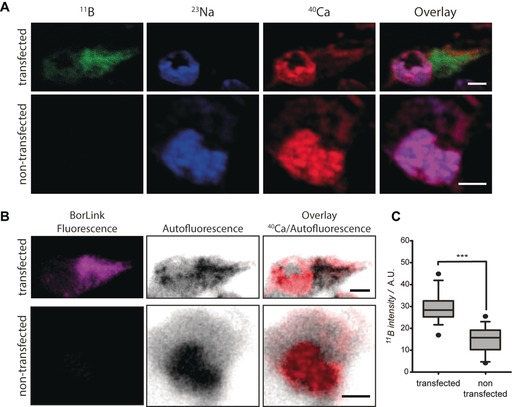
COS‐7 cells transfected with the protein TOM70‐GFP and labeled afterwards with BorLink‐GFP‐Nbs. A) NanoSIMS images of 11B signal (green) in transfected and non‐transfected cells. 23Na (blue) and 40Ca (red) are also shown, as well as overlay images of 11B, 23Na, and 40Ca. Scale bar=5 μm. B) Images of the transfected and non‐transfected cells obtained with an epifluorescence microscope before the nanoSIMS measurement. Although the different pixel sizes and imaging depth of the two procedures makes it difficult to overlay the two images perfectly, the fluorescence and 11B signals are in agreement in the transfected cells. Scale bar=5 μm. C) Plot of the normalized boron signal intensity for transfected cells compared to non‐transfected cells (*** p<0.0001). Analyzed number of ROIs: 150.
