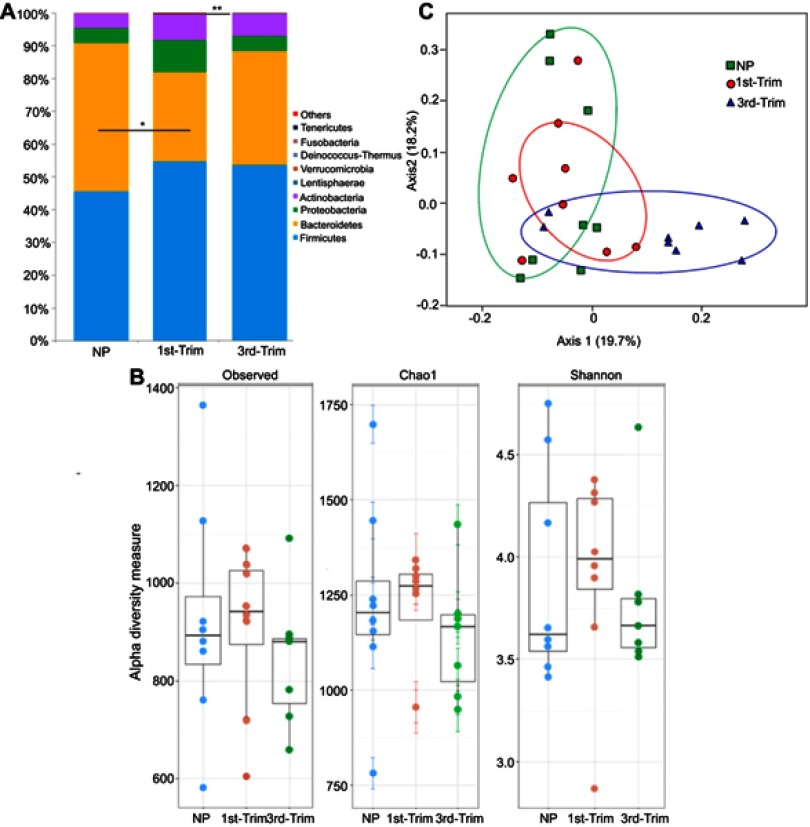
Figure 1.
(A) Graphical presentation of average relative densities of detected phyla in percentage. The x-axis shows group name and y-axis indicates average abundance in percentage. Others indicate minor phyla. *Significant at p<0.05. **Highly significant at p≤0.01. (B) Alpha diversity analysis of 16S amplicon data. The first trimester group (1st-Trim) exhibited greater diversity and richness (shown by observed and Chao1 indices), and higher Shannon index compared to third trimester (3rd-Trim) and non-pregnant (NP) groups. (C) Weighted UniFrac analysis of 100 most abundant operational taxonomic units. The variation percentage explained by the correspondence coordinates is indicated on the axes. Dots represent sample relative positions and respective group samples are interlinked. Groups are respectively colored.
Abbreviations: NP, non-pregnant group; 1st-Trim, first trimester; 3rd-Trim, third trimester.

