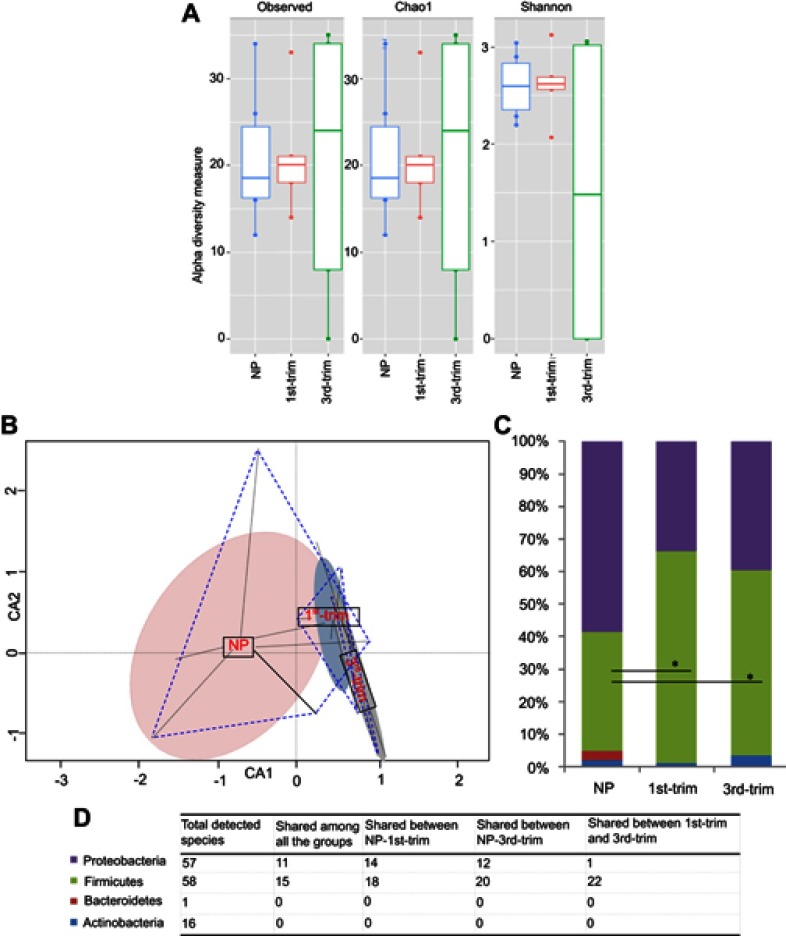
Figure 2.
Diversity, structural, and compositional changes observed according to trimester using a culturomic approach. (A) Alpha diversity analysis of culturomic data. (B) Constrained ordination analysis. Species' occurrence and abundance differed among the groups. The non-pregnant (NP) group had comparatively more diverse and abundant species. Projecting lines from each group correspond to samples. (C) Average relative percentage abundance of phyla. Annotation of phyla is same as shown in the D-section of the plot. Count data were first transformed with the Hellinger transformation method. After normality test, statistical significance was performed with ANOVA, and Bonferroni correction was applied. *Significant at p<0.05. (D) Tabular presentation of total species' identified in each phyla and study group.
Abbreviations: NP, non-pregnant group; 1st-Trim, first trimester; 3rd-Trim, third trimester.

