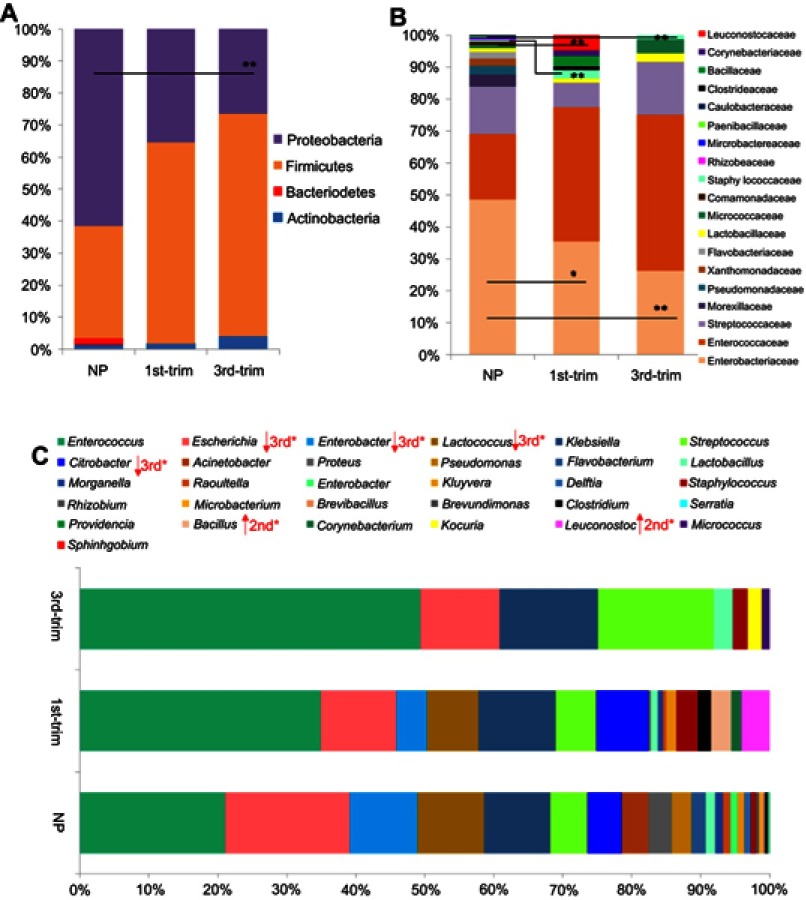
Figure 3.
Comparisons of the relative abundance of antibiotic-resistant taxa. (A) A comparison of the relative abundance of antibiotic-resistant phyla. (B) A comparison of the relative abundance of antibiotic-resistant families. (C) A comparison of the relative abundance of antibiotic-resistant genera. Data are shown as percentile abundances in each group. Before statistical analysis, count data were transformed with the Hellinger method and analyzed for normality. Taxa with normal distribution were analyzed using ANOVA with Dunnett's post hoc test, while non-normal data were analyzed with Kruskal–Wallis and p-values were corrected.
Abbreviations: NP, non-pregnant group; 1st-Trim, first trimester; 3rd-Trim, third trimester.

