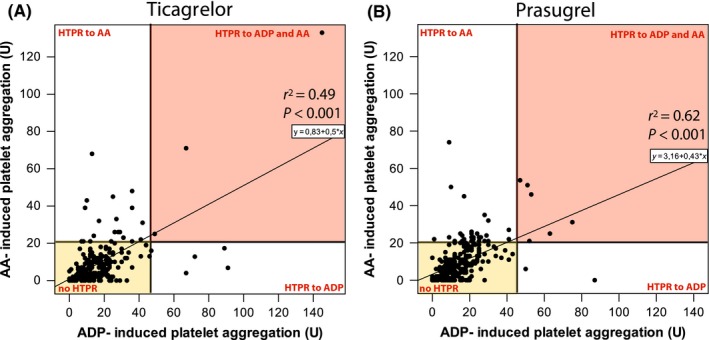
Figure 5.

Scatter plot showing the correlation between arachidonic acid (AA) and adenosine diphosphate (ADP) – induced aggregation assessed by multiple electrode aggregometry (MEA) in ticagrelor (A) and prasugrel treated patients (B). HTPR: high on treatment platelet reactivity
