Figure 3.

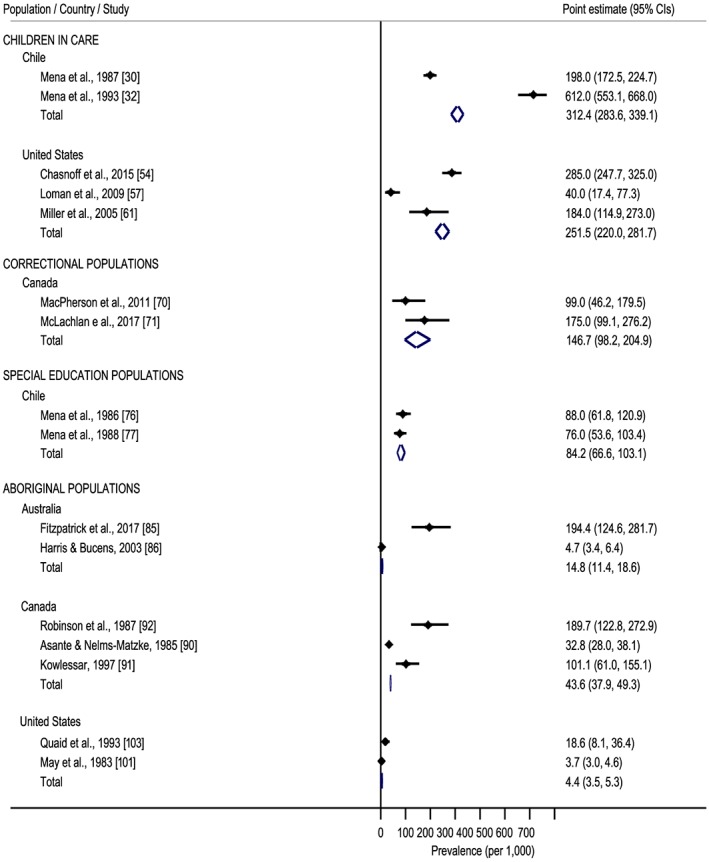
Forest plot of meta‐analysed fetal alcohol spectrum disorder (FASD) prevalence studies. [Colour figure can be viewed at wileyonlinelibrary.com]

Forest plot of meta‐analysed fetal alcohol spectrum disorder (FASD) prevalence studies. [Colour figure can be viewed at wileyonlinelibrary.com]