
Figure 2.
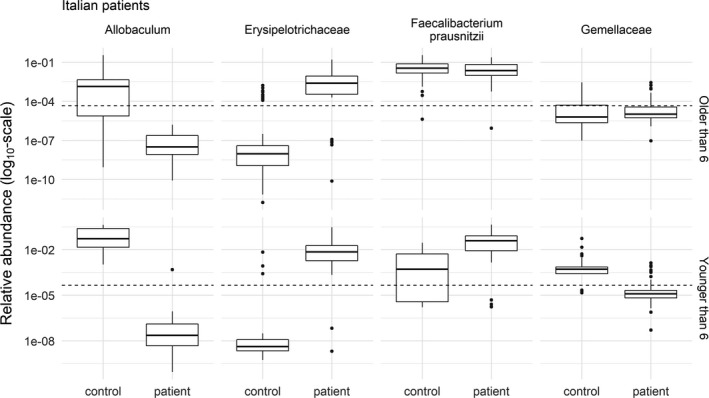
Relative abundance of the 4 operational taxonomic units with the strongest evidence of differences between Italian patient baseline samples (n = 78) and healthy controls (n = 79). The age of the subjects confounded the relationship between patient/control status and the relative abundance. Therefore, the plots were divided into patients older (top) and younger (bottom) than the median age of 6 years. The relative abundances are shown, and the analysis was performed on the log ratio of the relative abundances. The broken lines show the limit of detection at a relative abundance of 4.5 × 10⁻⁵. Relative abundances below the broken line were not observed, but were the results of imputation. Note the log10 transformation of the y‐axis. Data are shown as box plots, where the lines inside the boxes represent the median. Each box represent the 25th to 75th percentiles. Lines outside the boxes show the highest and lowest observations still within 1.5 times the interquartile range removed from the upper and lower quartile, respectively. Circles indicate outliers.