
Figure 3.
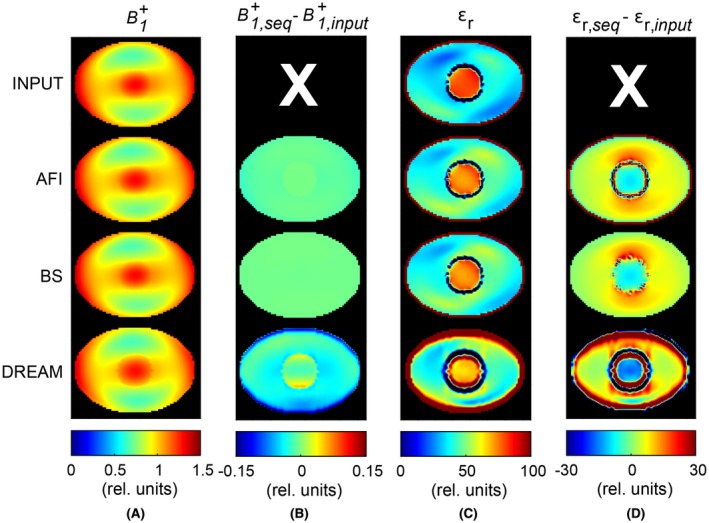
Phantom simulation study to assess the accuracy of both and εr, which were obtained with the EM simulation (“input,” first row), AFI (second row), BS (third row), and DREAM (fourth row). No noise was added. A, maps. Values for the maps were normalized to the average value in the central slice. B, Map of the error in (B + 1,sequence – B + 1,input ). C, Permittivity maps, which were reconstructed from the maps shown in (A) and the simulated transceive phase. D, Map of the error in εr (εr,sequence – εr,input ). Note that the input permittivity (εr,input) accounts for the transceive phase assumption and is therefore the best permittivity that can be obtained with this EPT reconstruction method