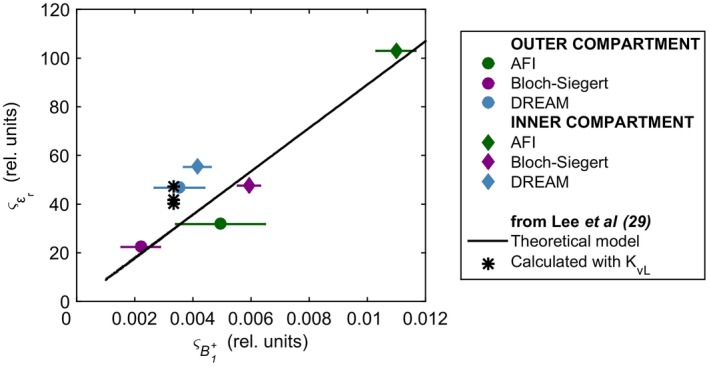
Figure 7.

Experimental relationship between and . Both and were evaluated in 2 manually delineated ROIs matching the phantom inner and outer compartments. For , the average value is displayed. The horizontal bars indicate the spread (std) of the in both ROIs. The black line represents the theoretical model29 relating and for the noise‐robust kernel KvL (Equation 18 in Lee et al,29 where Ntot= 117, L =√67, G = 290.2, and ≈ 1/). The black asterisks refer to the std values of the permittivity calculated by Lee et al29 inside 3 ROIs, for a simulated phantom map with fictitious = 300
