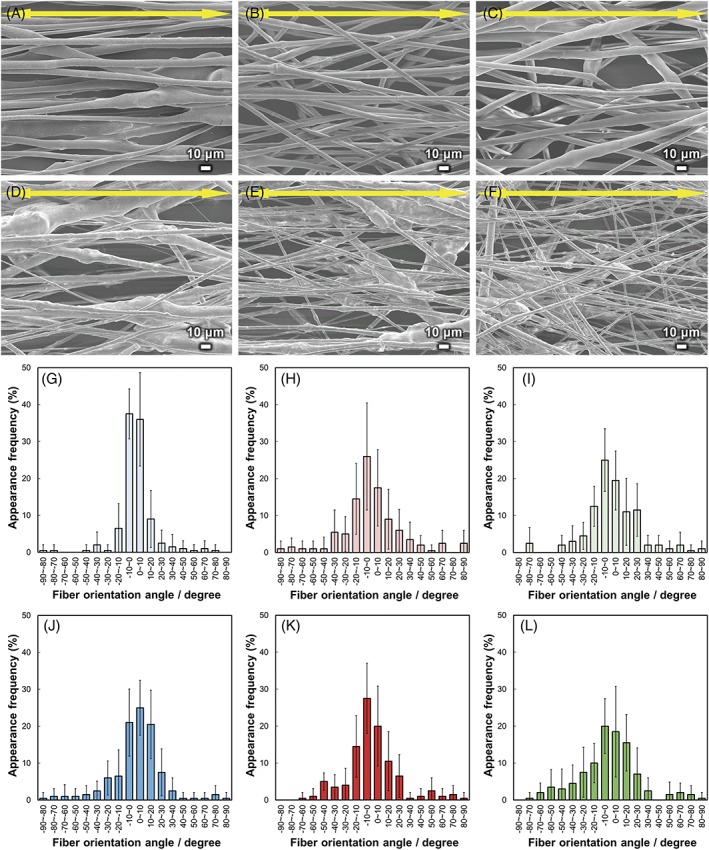
Figure 3.

SEM images of (A) BGMg10, (B) BGCa10, (C) BGSr10, (D) BGMg30, (E) BGCa30, and (F) BGSr30. Arrows indicate the collector rotation direction. Fiber orientation angle histograms for (G) BGMg10, (H) BGCa10, (I) BGSr10, (J) BGMg30, (K) BGCa30, and (L) BGSr30. Error bars represent the standard deviation.
