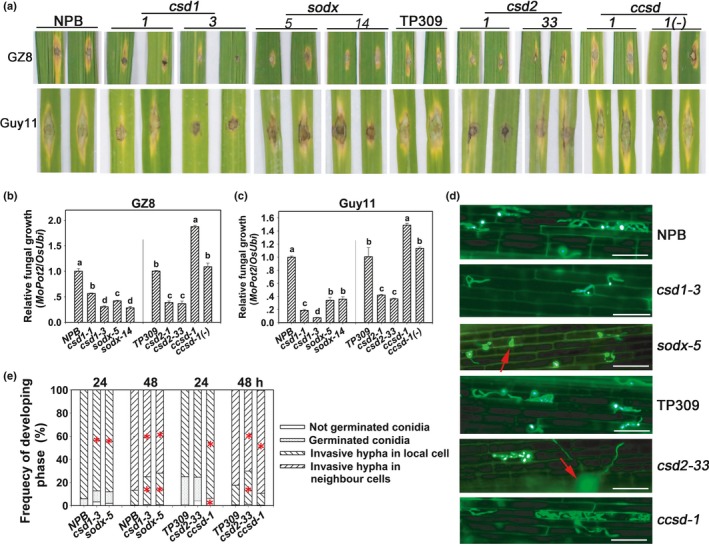
Figure 2.

Mutations in miR398b target genes alters sensitivity to Magnaporthe oryzae. (a) Disease phenotypes of the indicated mutant lines (Cu/Zn‐Superoxidase dismutase (csd)1, csd2, copper chaperone for superoxide dismutase (ccsd), superoxidase dismutase (sod)x, ccsd‐1 segregated azygous line (ccsd‐1(‐))) and their corresponding controls (Nipponbare (NPB), Taipei 309 (TP309)) at 5 d post‐inoculation (dpi) by M. oryzae strains GZ8 and Guy11. (b, c) Relative fungal biomass on the inoculated leaves of the inoculated lines at 5 dpi. The relative fungal biomass was measured by using the DNA amount of M. oryzae Pot2 against the rice genomic ubiquitin DNA amount. Values are means ± SD of three replications. Different letters above the bars indicate significant differences at P < 0.01 as determined by a one‐way ANOVA followed by post hoc Tukey honest significant difference (HSD) analysis. (d) Representative epifluorescent microscopic images show the growth of the eGFP‐tagged M. oryzae strain GZ8 on sheath cells of the indicated mutant lines and the control lines at 36 h post‐inoculation (hpi), respectively. Red arrows indicate germinated but not invaded conidia. Bars, 50 μm. (e) Quantitative analysis of M. oryzae growth. More than 200 conidia in each line were analyzed. Significant differences between the corresponding wild‐type controls and mutant lines as determined by a one‐way ANOVA followed by post hoc Tukey HSD analysis are indicated: *, P < 0.05. All of the experiments were repeated two times with similar results.
