Figure 1.

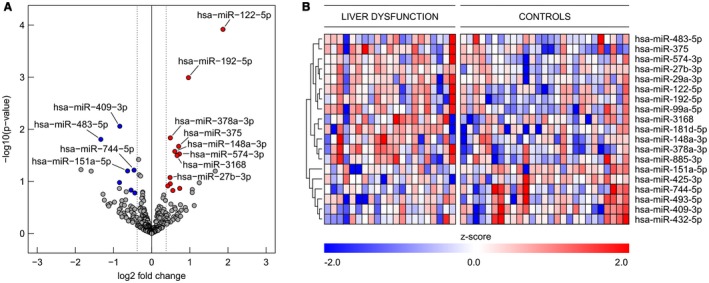
Differences in presurgical microRNA patterns in patients undergoing liver resection. (A) Volcano plot of differentially regulated microRNAs in presurgical plasma of patients with LD. To identify biomarker candidates, cutoffs for plasma concentration (average logCPM > 5), effect size (fold change > 1.3), and significance level (raw P < 0.2) were implied. A set of 19 microRNAs, of which 12 were up‐regulated (red) and 7 were down‐regulated (blue), was identified. (B) Expression heat map of regulated miRNAs in plasma of patients (miR‐wise z score of log2 [CPM + 1]); red indicates higher expression than the mean and blue indicates lower expression than the mean, according to the legend at the bottom.
