Figure 3.

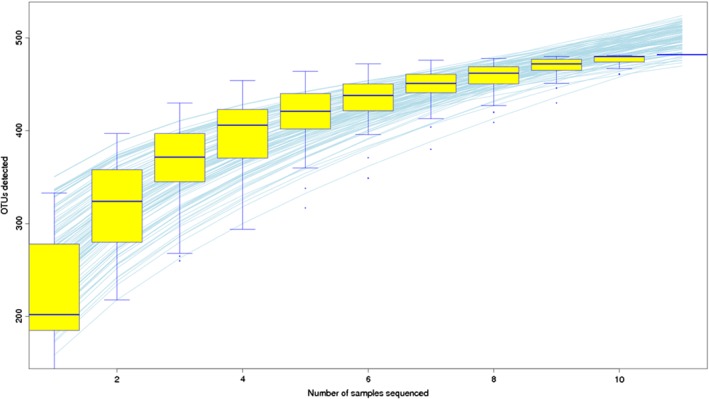
The rarefaction curves produced by the boxplots represent the number of sample sequences against the number of OTUs, and tended towards the saturation plateau.

The rarefaction curves produced by the boxplots represent the number of sample sequences against the number of OTUs, and tended towards the saturation plateau.