
Figure 4.
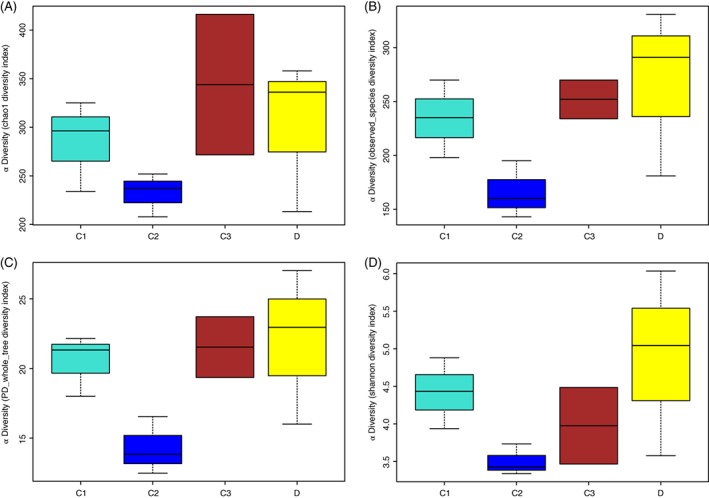
Showing the alpha diversity indices (wilcox.test function in R for both sets of samples and the kruskal.test function in R if more than two sets of samples were used). The observed species index (B) and the Chao index (A) reflect the species richness of the communities in the sample. The whole tree phylogenetic diversity index (C) reflects the species diversity of the communities affected by species richness and species evenness in the sample community. The Shannon index (D) reflects the difference in species preservation in the sample from evolutionary history.