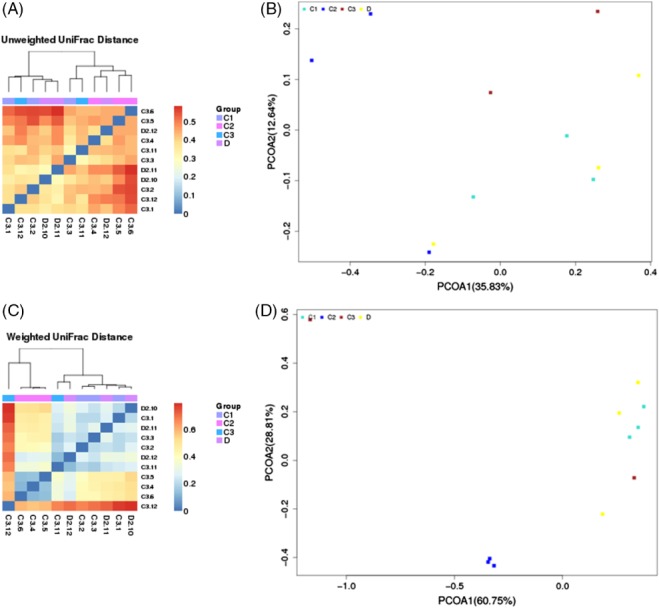
Figure 5.

Showing the UniFrac distance distribution heat map with respect to clustering samples with similar beta diversity; the clustering UniFrac results reflects the similarity between samples. The UniFrac results are divided into two types: (A) (unweighted UniFrac) and (C) (weighted UniFrac). The weighted UniFrac considers the sequence abundance and the unweighted UniFrac does not consider the abundance. PCoA analysis [(B): Unweight_UniFrac] and [(D): Weight_UniFrac].
