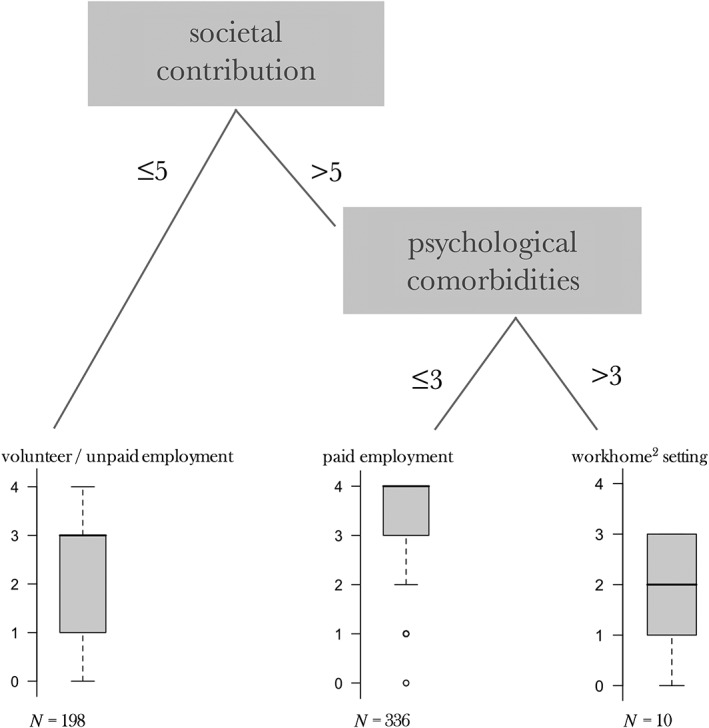
Figure 2.

Regression tree based on the NAR sample, grown with a requirement of P < 0.001 for a split to be implemented. The response node in this tree is the five‐point scale of level of daily activities at a later assessment wave of the NAR study. The P‐values stem from binary association tests for variable and cutoff value selection. A low P‐value equals high impurity reduction.
