Figure 1.

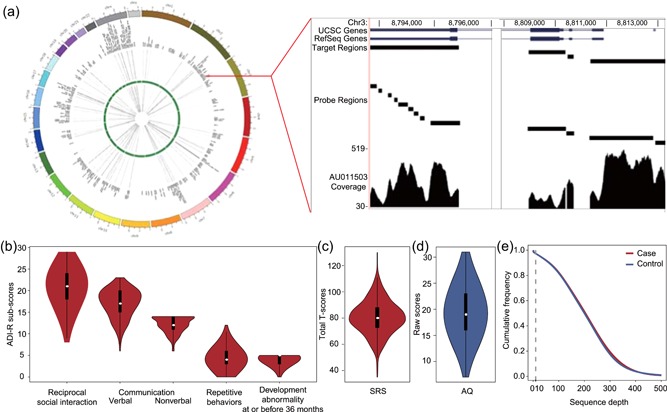
Characteristics of the targeted panel and the case–control cohort. (a) The sequencing depths of targeted genes for 1,004 qualified samples are summarized in heatmaps inside the Circosmap, with cases and controls shown outside and inside the green circle, respectively. The targeted resequencing depths are proportional to the color depth. The right panel illustrates the capture sequencing details of one region of interest in case AU011503 as an example. (b) The raw score distributions of ADI‐R content areas (quality of social interaction; communication and language; repetitive, restricted, and stereotyped interests and behavior; and evidence of onset of the disorder by 36 months of age) for the cases are represented by violin plots. The y‐axis shows the raw score of each ADI‐R subdomain. The ADI‐R‐specified cutoffs for these subdomains were 10, 8, 7, 3, and 1, respectively. (c) The distribution of the SRS total T‐scores of cases is shown as a violin plot. (d) The distribution of the AQ raw scores of controls, for whom the scores were below the cutoff of 32. (e) Cumulative frequency distribution of the sequencing depth in all 1,004 samples. The read depth is consistent across both cases and controls. ADI‐R: Autism Diagnostic Interview‐Revised; AQ: Adult Autism Spectrum Quotient; SRS: Social Responsiveness Scale
