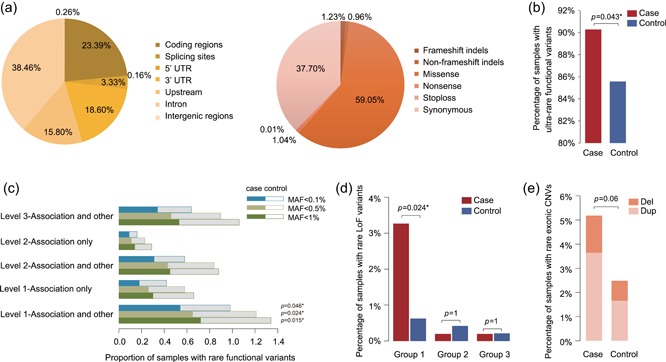
Figure 2.

Variant spectra and differences between cases and controls. (a) The distribution of different types of variants for all targeted regions (left pie chart) and the targeted coding regions (right pie chart). (b) The percentage of cases (red bar) with ultra‐rare functional variants in 358 genes was significantly higher than that in controls (blue bar) (p = 0.043 by logistic regression). (c) The differences in the proportion of rare variants between cases and controls for five subgroups of nonsyndromic genes. The bars represent the proportions of cases (solid bars) and controls (hollow bars) that carried the corresponding variants, as grouped by subgroups and MAF. Only rare functional variants in the “Level 1—Association and other” gene set were significantly enriched in cases when compared with the controls. The adjusted p values after Bonferroni correction are shown on the right of the bars. (d) Comparison of the percentage of samples with rare LoF variants in syndromic genes following their inheritance patterns in cases (red bar) and controls (blue bar) grouped by subgroups. Only the variants in the Group 1 gene set were detected in more cases than controls, and the difference was statistically significant (adjusted p = 0.024 by logistic regression after Bonferroni correction). (e) Comparison of rare autosomal exonic CNVs detected in cases and controls. The proportion of samples with deletions is shown in the upper bar and that of duplications is shown in the lower bar. CNV: copy number variant; MAF: minor allele frequency
