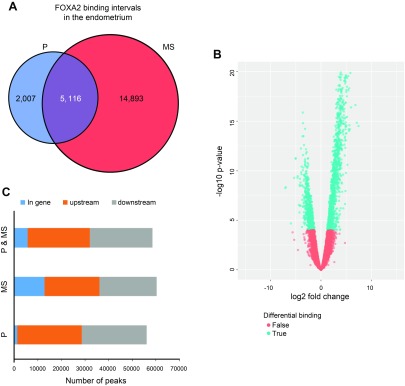
Figure 2.
ChIP-Seq analysis of FOXA2 binding in the P- or MS-phase endometrium. A) Venn diagram of nonredundant FOXA2 intervals in the P- and MS-phase endometrium. B) Volcano plot illustrating the pattern of differential binding of FOXA2 binding locations in the endometrium during the P and MS phases. The locations with log-fold change >0 are associated with MS phase, and those with log fold change <0 are associated with the P phase. Thus, more FOXA2-bound genes are found in the MS than in the P phase. C) Distribution of genome-wide FOXA2 binding intervals relative to TSSs of nearby genes.

