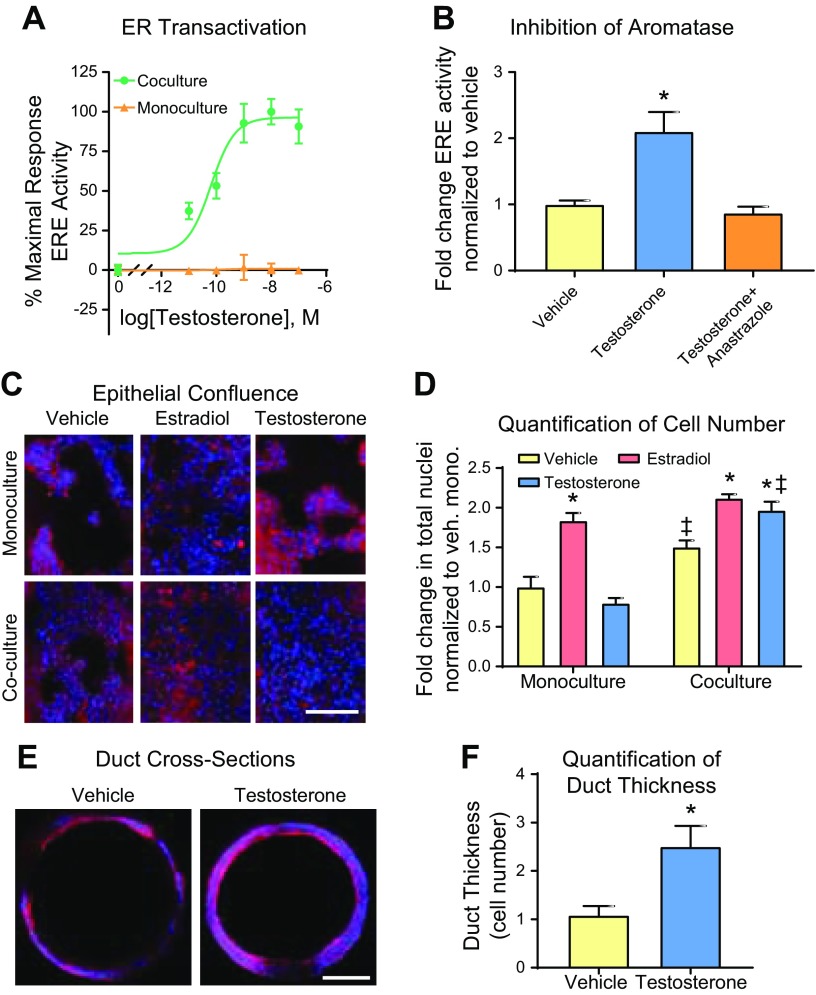
Figure 1.
T induces ER-driven responses in MCF7-derived ducts cocultured with AdMSCs. A) ER transactivation was evaluated in MCF7-derived ducts grown alone or with AdMSCs after a 48-h exposure to 5 doses of T. B) MCF7-derived ducts cocultured with AdMSCs were exposed to a vehicle control (0.1% ethanol), T (100 nM), or T and anastrazole (1 µM) for 24 h then evaluated for ER transactivation. C) After a 5-d exposure to a vehicle control, E2 (100 nM), or T, MCF7-derived ducts cultured alone or in coculture with AdMSCs were fixed then stained for nuclei (blue) and F-actin (red). D) Cell number was quantified by counting the number of nuclei within each duct. E) After a 5-d exposure to a vehicle control or T, MCF7-derived ducts cocultured with AdMSCs were fixed, stained for nuclei and F-actin and cross-sectioned to evaluate hyperplasia. F) Hyperplasia was quantified by counting the number of cells lining the duct at 6 evenly spaced points along each duct. *P < 0.05 vs. vehicle, ‡P < 0.05 vs. respective monoculture.

