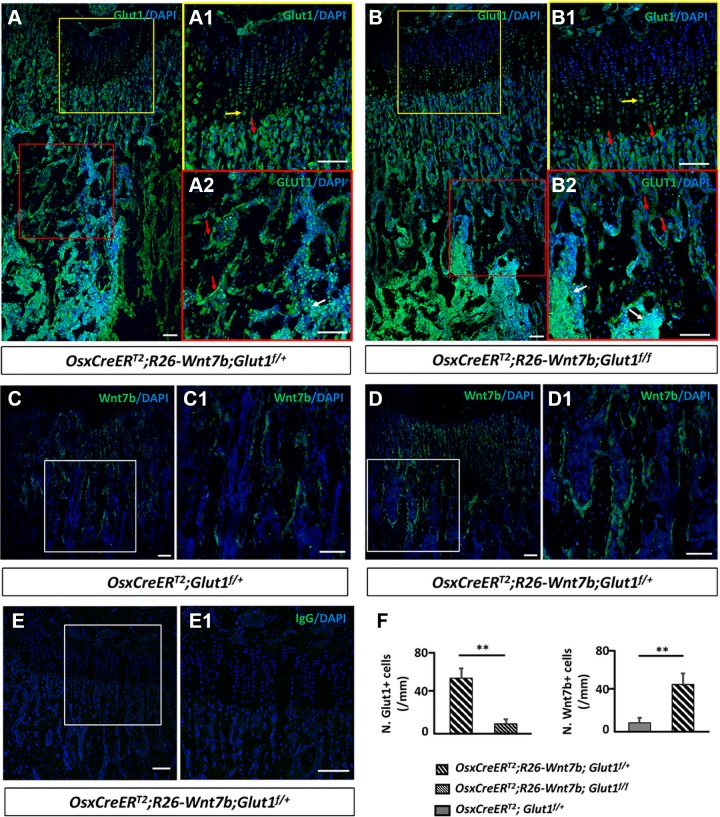
Figure 2.
Osx-CreERT2 induces Glut1 deletion and Wnt7b overexpression in osteoblast lineage cells. A–E1) Representative images of immunofluorescence staining on longitudinal sections of the femur with antibodies against Glut1 (A, B), Wnt7b (C, D), or control IgG (E). Boxed areas shown at a higher magnification to the right for growth plate (A1, B1, E1) or trabecular bone region (A2, B2, C1, D1). Immunostaining signal in green, DAPI nuclear staining in blue. F) Quantification of immunostaining data. Number (N.) of Glut1+ or Wnt7b+ cells normalized to trabecular BS in primary ossification center of proximal end of tibia. Red arrow, osteoblast; yellow arrow, chondrocyte; white arrow, blood cells. Scale bars, 100 μm. ** P < 0.01, Student’s t test (n = 3 mice, 1 section/mouse).

