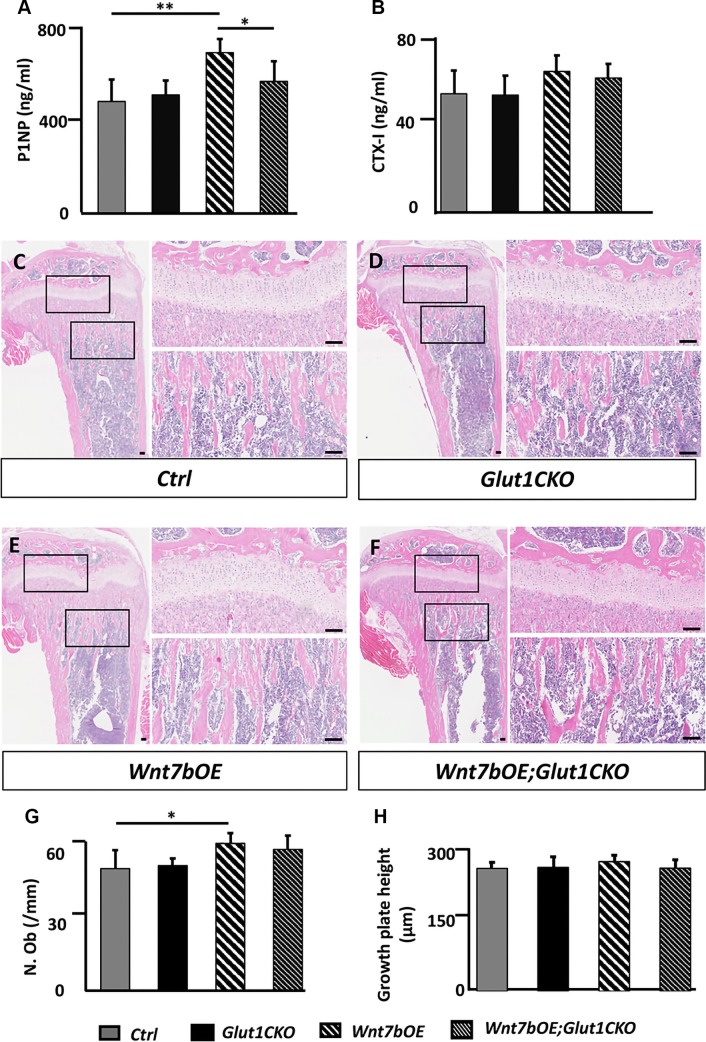
Figure 4.
Glut1 deletion impairs Wnt7b-induced bone formation. A, B) Serum levels of P1NP (A) or CTX-1 (B). C–F) Representative H&E tibial sections used for histomorphometric quantification. Boxed areas shown at a higher magnification to the right for growth plate (upper) or trabecular bone region (lower). Scale bars, 100 μm. G) Quantification of trabecular osteoblast numbers within the primary ossification center of the proximal end of the tibia. The region of interest was defined as a rectangular box of a fixed size at 100 μm below the growth plate with the long axis parallel to the growth plate. H) Measurements of the growth plate height. N. Ob, number of osteoblasts. *P < 0.05, **P < 0.01 by 2-way ANOVA followed by Bonferroni’s post hoc test (n = 5).

