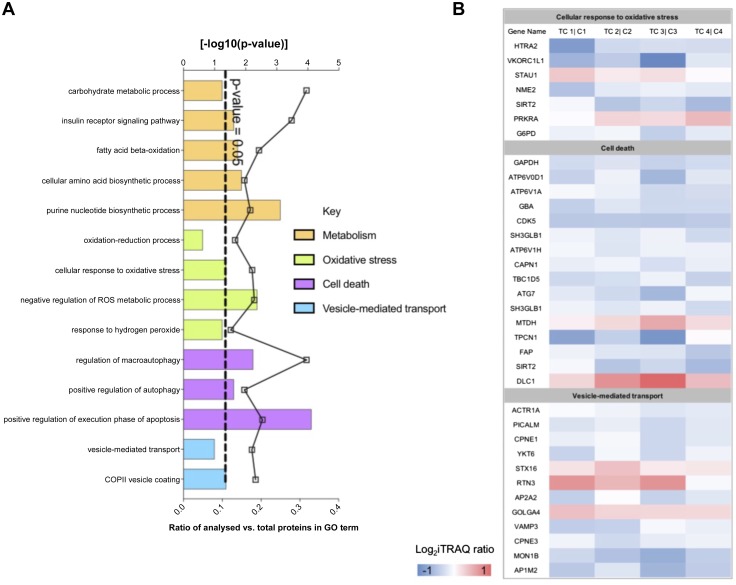
Figure 6.
A) GO analysis of the differentially expressed proteins following 8 h exposure of placental villous fragments to TC vs. controls showed significant enrichment for GO terms related to metabolism, cell death, oxidative stress, and vesicle-mediated transport. The dotted line indicates a value of P = 0.05. B) Differentially expressed proteins that map to significant pathways (cellular response to oxidative stress, cell death, and vesicle-mediated transport) presented in heatmap format representing the ratio of expression in treated vs. control samples for each placenta.

