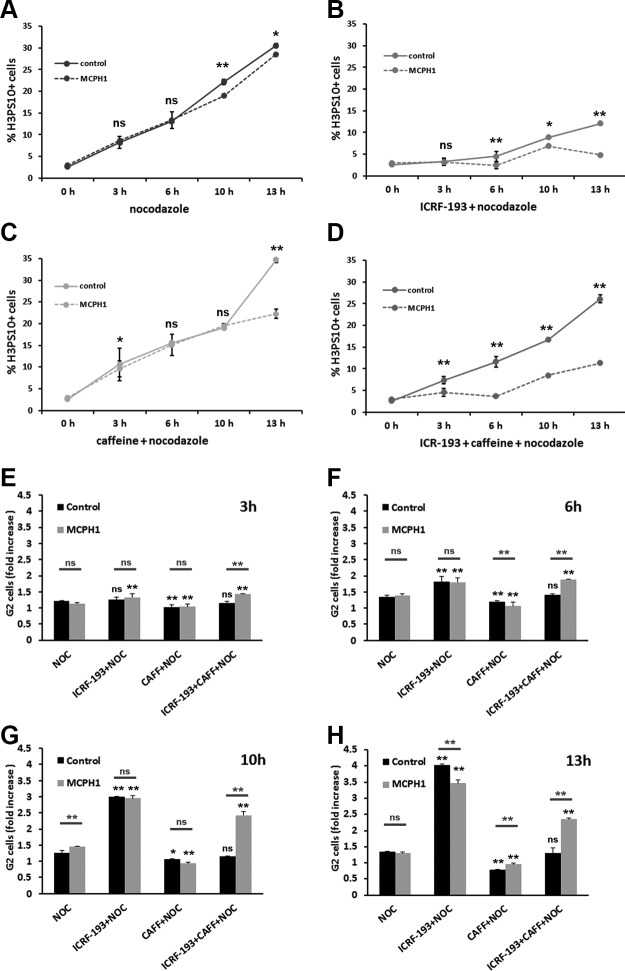
Figure 1.
A–D) Frequency of histone H3PS10–positive cells in control and MCPH1 cells determined by flow cytometry after incubation with nocodazole alone (A) or combined with either ICRF-193 (B), caffeine (C), or both (D) for the indicated time points. Mean and range (bars) data from 2 independent experiments are presented. Pooled data from control and patient cells were compared by χ2 test of independence. E–H) Fold increase of G2 cell fraction, related to untreated samples, in control and MCPH1 cells incubated as described in A–D during 3 h (E), 6 h (F), 10 h (G), and 13 h (H). Mean and range (bars) data from 2 independent experiments are presented. For each time point, pooled data for each treatment were compared independently in control and patient cells by χ2 test of independence to nocodazole-treated cells. Furthermore, for each treatment and time point, control and patient data were pairwise compared by χ2 test of independence (underlined). CAFF, caffeine; NOC, nocodazole; ns, nonsignificant. *P < 0.01, **P < 0.001.

